
purrr: info
Provides tools for working with functions and vectors
The purrr family of functions helps us replace for loops, making our code easier to read and more succint.
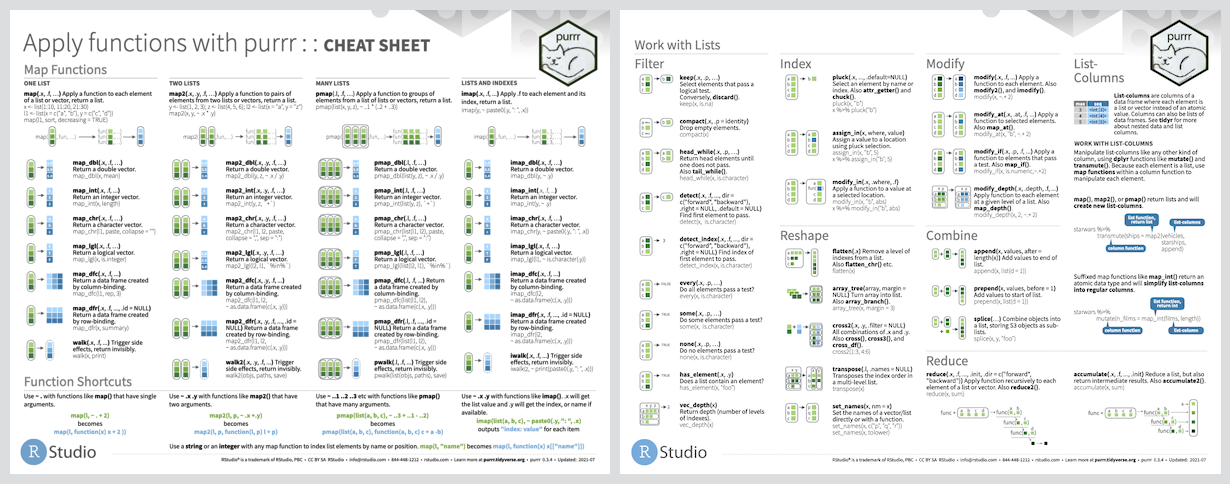
With purrr you can
- Iterate over a single input with
map() - Iterate over two inputs in parallel with
map2() - Iterate with multiple arguments with
pmap() - Iterate with multiple arguments and functions with
invoke_map() - Call a function for its side-effects with
walk(),walk2(), andpwalk()
 {fig-alt=“R4DS book cover”}
purrr: exercise
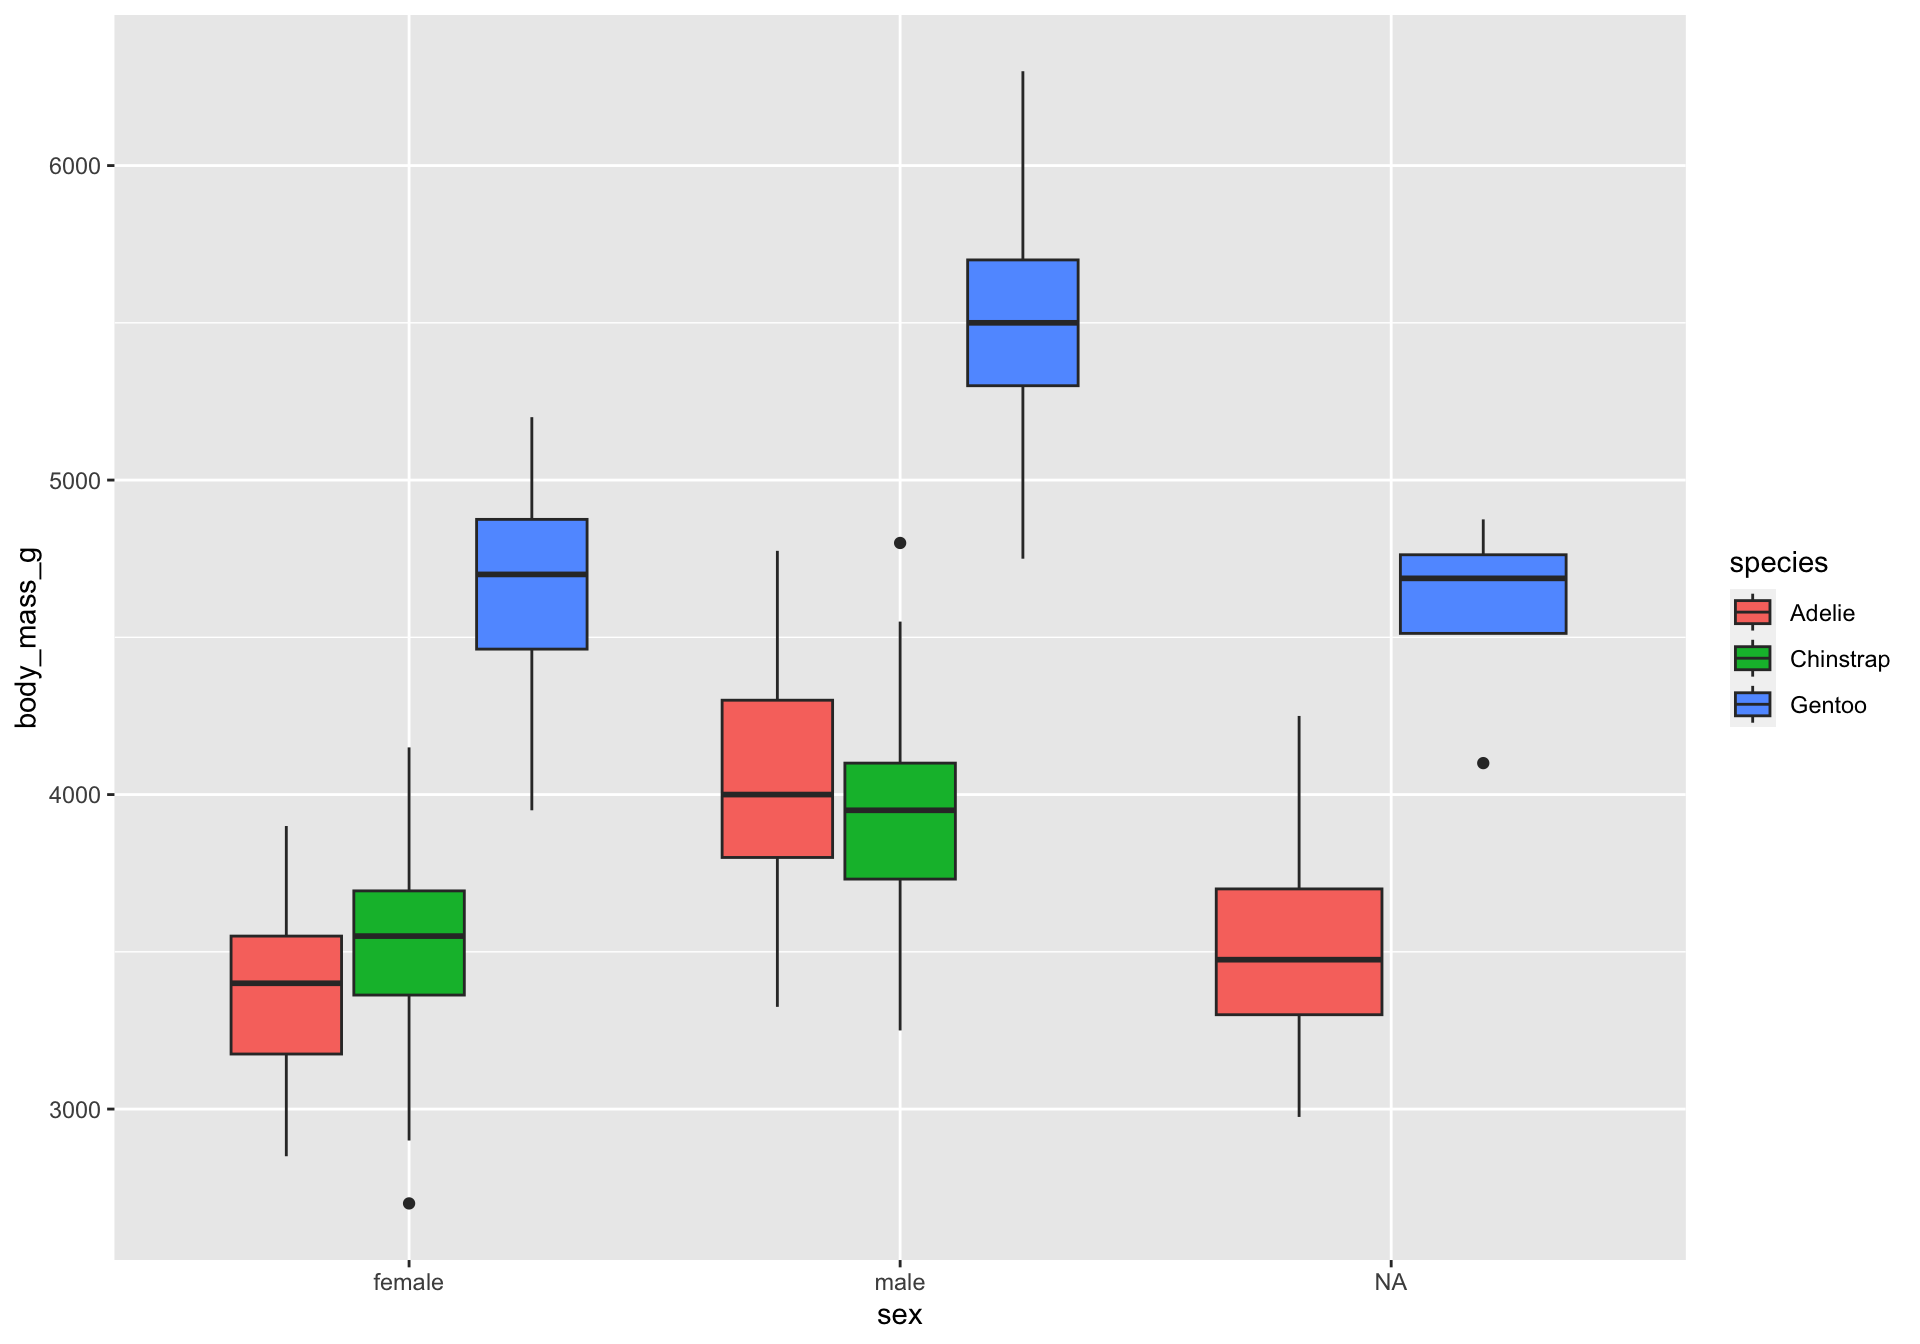
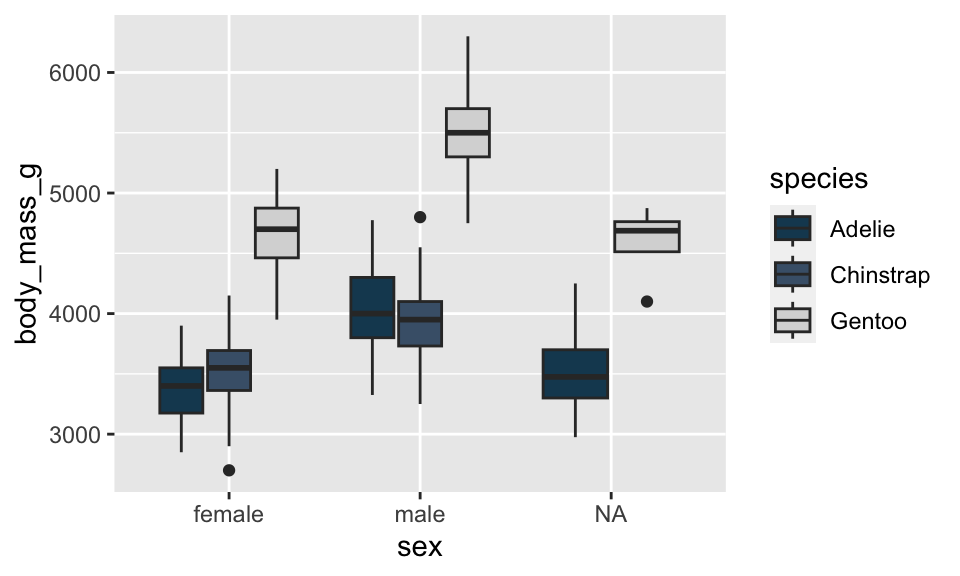
Ok, we love our earlier boxplot showing us body_mass_g by sex and colored by species…
…but let’s change up the colors to keep with our Antarctica theme!
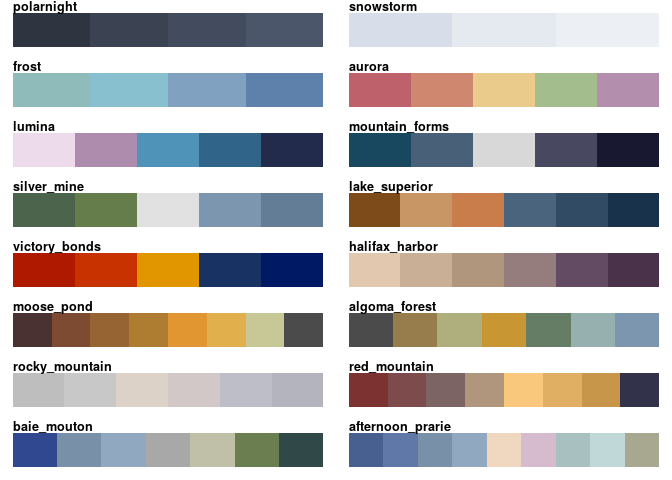
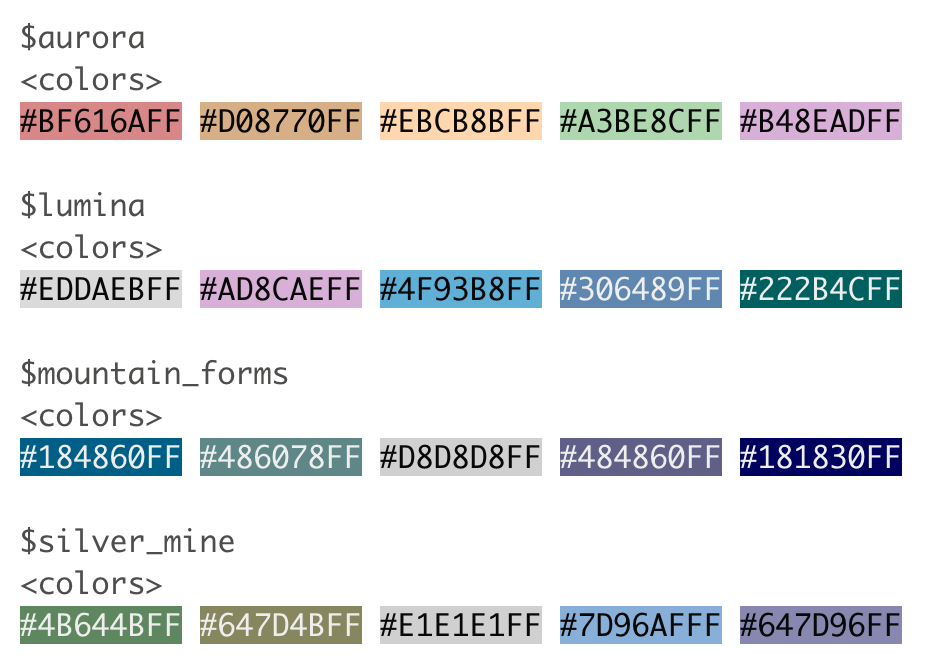
I’m a big fan of the color palettes in the nord 📦
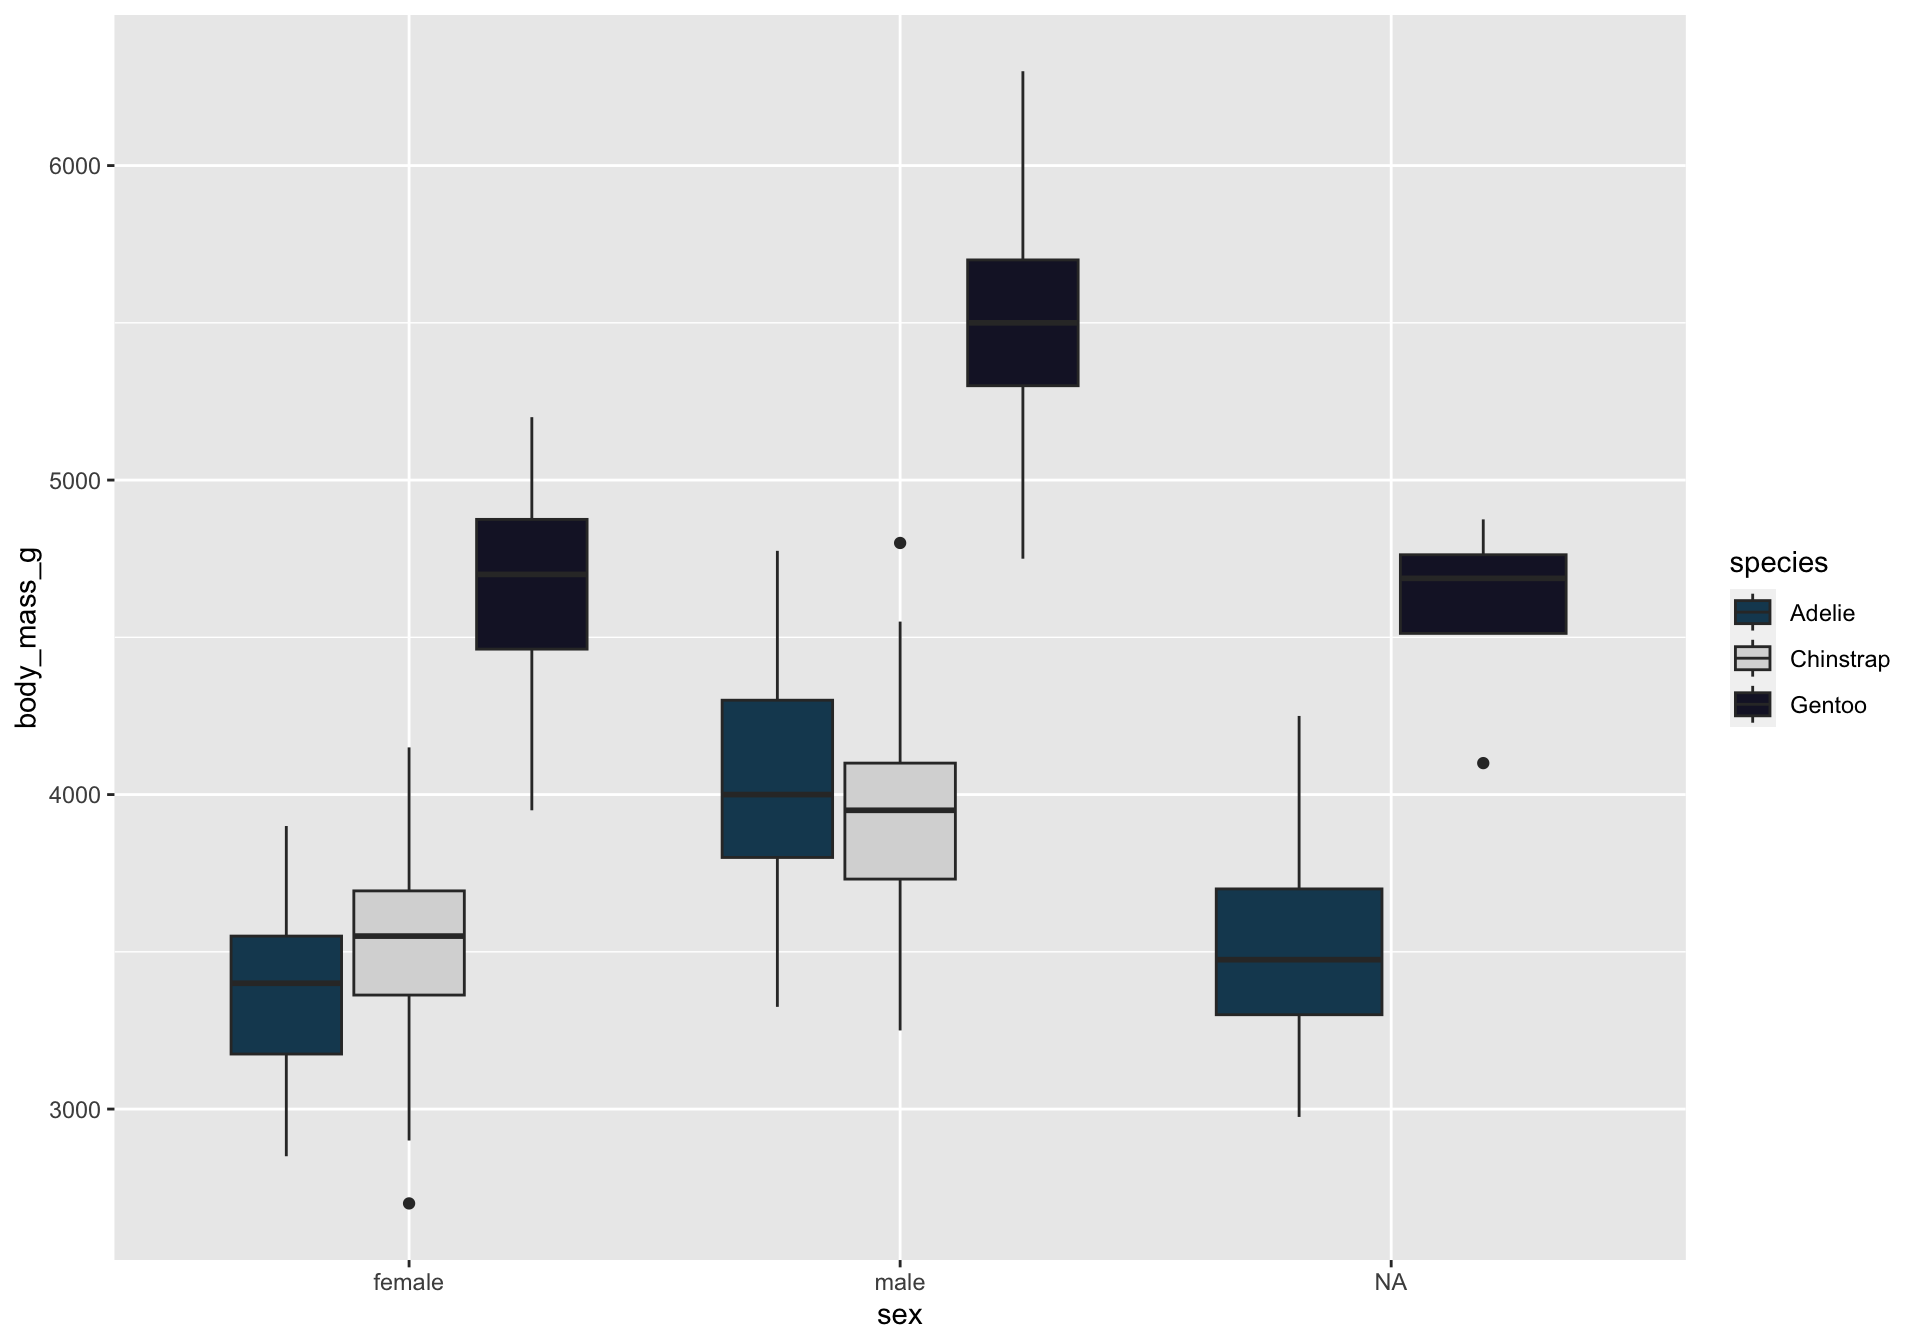
Let’s turn this plot…
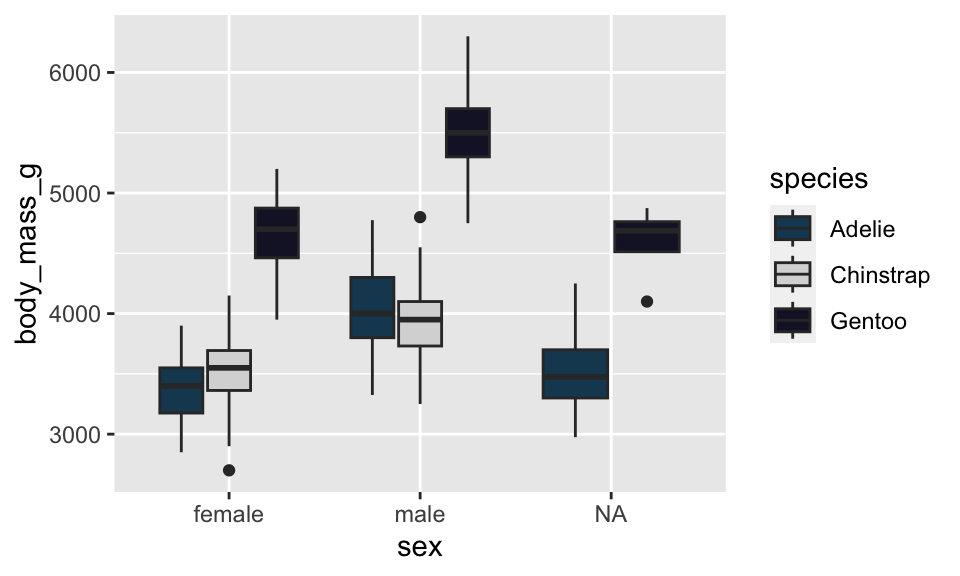
…into this one!
Note: The color choices in this example are meant for demo purposes only. Be sure to consider the accessibility of your data viz, including color contrast between different elements.
You can choose colors using
the color hex codes
And assign them using the scale_fill_manual() function

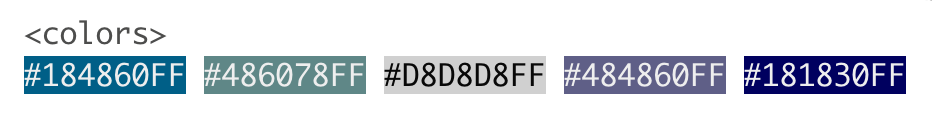
You can also use the palette name, like mountain_forms, though the colors assigned may not align with what you want
The prismatic 📦 helps us see the colors that correspond to each color hex code (mostly), with the color() function
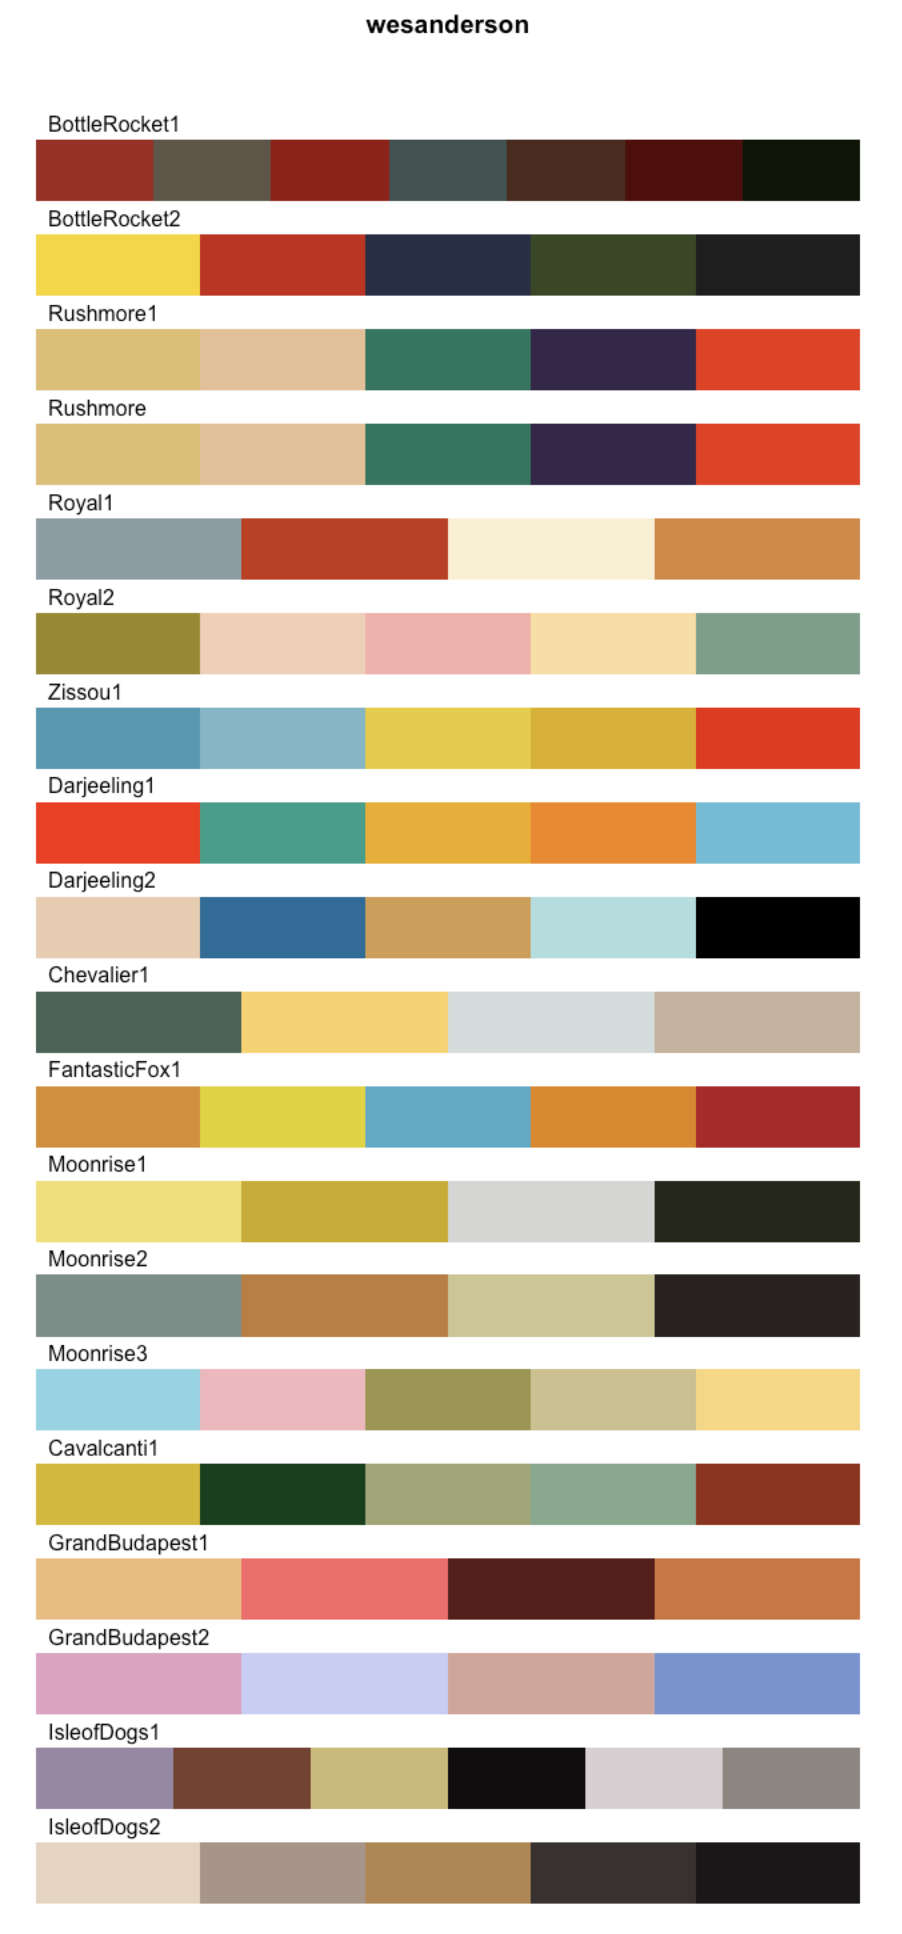
🎨 r-color-palettes repo from Emil Hvitfeldt
Like this Wes Anderson themed one! And many, many others 🤩